 Students/Staff
 Parents
 ElevatEd
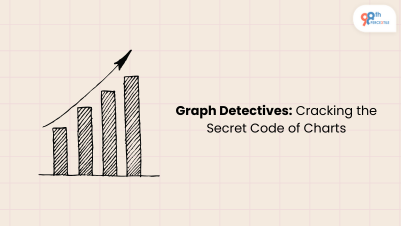
Imagine of a twelve-year-old Max gazing at a cluster of numbers that could just as well be a foreign language. Then his math tutor plots a line graph, and - BOOM! - those mysterious numbers are immediately a narrative that jumps off the page. The random dots get linked, patterns get established, and what is confusing is as clear as daylight. Welcome to the universe of mathematical graphs - where numbers dance and data tells its most thrilling tales.
Graphs are not just dots and lines on paper. They are wonderful translators who convert difficult numerical facts and figures into pictures that all can understand. From predicting weather patterns to graphing video game high scores, graphs are math superheroes.
The Graph Family: Meet the Mathematical Storytellers
"Mathematics is the music of reason." - James Joseph Sylvester
Let's discover the amazing forms of graphs that allow us to make sense of the world:
The Graph Gallery: A Visual Guide
|
Graph Type |
What It Reveals |
Best Used For |
Cool Fact |
|
Line Graph |
Evolution over time |
Monitoring trends, advancement |
Used to predict stock market behavior |
|
Bar Graph |
Comparison across categories |
Comparing quantities |
Originally used by William Playfair in 1786 |
|
Pie Chart |
Characteristics of a totality |
Showing percentages |
Developed by William Playfair in 1801 |
|
Scatter Plot |
Relationship between variables |
Inferring co-occurrence or patterns |
Used in clinical trials to correlate factors |
|
Histogram |
Dissemination of quantitative information |
Recognizing data spread |
Illustrates how data are categorized |
|
Box Plot |
Outliers and data dispersion |
Statistical analysis |
Reports median and extreme values |
Graph Decoding Superpowers
Line Graphs: The Time Travelers
Think about monitoring how many books you read in every month. A line graph is your reading life - peaks, valleys, and all the rest. Each point is a month, and the line joins the points to indicate your reading pattern.
Bar Graphs: The Comparison Champions
Need to compare pizza topping preferences? Use bar graphs! Each bar is a topping, and the height of each represents how many love it.
Pie Charts: The Percentage Wizards
Think of a pie chart as a pizza divided into wedges. Each wedge is a percentage of the whole pie - perfect for showing how you spend your allowance or class time management.
|
Did You Know?
|
Master Statistical Visualization Today!
Graph Detective Challenge: Be a Data Decoder!
Can you guess what each graph might represent?
- A zigzag line graph
- Pie chart with colored slices of different hues.
- Different height vertical bars
Answers:
- Temperature fluctuations, share prices, or reading progress
- Budget analysis, in-class topic selection, or pizza topping vote
- Monthly sales, student test scores, or population comparison
Parent's Toolkit: Making Graphs Fun at Home
- Snack Tracker: Create a bar chart of family's favorite snacks
- Chore Chart: Track weekly chores completed using a line graph
- Weather Watchers: Create a line graph of temperatures every day
- Reading Adventure: Plotting books read on a line graph each month
- Pocket Money Planner: Split allowance with a pie chart
At 98thPercentile, our Math Olympiad curriculum is beyond expectations. We transform graphs from potentially daunting concepts into dynamic instruments of discovery. Our master curriculum guides students through:
- Understand graph construction and reading
- Develop critical thinking through data analysis
- Build confidence in visualizing mathematics
- Apply graphing skills in different contexts
Start Your Math Adventure with 98thPercentile Today!
The Real-World Graph Magic
Graphs are not homework assignments alone - graphs are useful tools used by:
- Scientists tracking climate change
- Doctors understanding disease spread
- Firms researching market trends
- Athletes optimizing performance
- Players following skill improvement
Learning the Graph Language: A Step-by-Step Tutorial
- Understand the fundamentals: Know what every type of graph shows
- Practice Reading: Interpret graphs in newspapers, magazines
- Create Your Own: Begin with basic graphs about subjects you are interested in
- Ask Questions: What is the graph telling?
- Connect the Dots: See how graphs reveal hidden patterns
The Graph Journey: From Confusion to Clarity
Every graph is a story to be told. Those circles, bars, and lines aren't just math notation - they're a connection between numbers and understanding. Reading and creating graphs, children develop a superpower: the ability to see patterns, forecast the future, and understand the world in a different way.
FAQs
Q1: At what age should children be exposed to graphs?Ans: Simple graph interpretation can start as early as 6-7 years old and become increasingly more complex as kids age. Simple bar and pie charts are excellent starting points for younger kids.
Q2: How can I help my child learn to read graphs?Ans: Bring graphs into everyday life - learn to read weather graphs, sports stats, or simply have fun doing family graphs with the family. Have fun, not drudgery.
Q3: Are computer programs helpful in learning graphs?Ans: Absolutely! Interactive online applications and apps can make learning graphs more interactive and experiential for children.
Q4: Which graph is most difficult for children to comprehend?Ans: Box plots and scatter plots are harder since they are more abstract. Start with simpler forms of graphs and move to harder ones.
Q5: How do graphs help with daily problem-solving?Ans: Graphs condense complex data into visual form, indicate trends, predict, and communicate results simply and clearly in a science, business, and research setting.
Related Articles


-Nov-18-2025-03-57-47-3267-AM.png?width=360&length=360&name=401x226%20(6)-Nov-18-2025-03-57-47-3267-AM.png)


-Jul-22-2025-03-16-52-8797-AM.png?width=360&length=360&name=401x226%20(6)-Jul-22-2025-03-16-52-8797-AM.png)